

From calibration to evidence: building a resilient liquidity risk framework
Executive summary
Regulators and investors increasingly expect fund managers to show that their liquidity management tools are calibrated to the costs a fund would actually face, not merely that the tools exist. This paper explains how market observations, impact modeling and liquidation scenarios can be combined into evidence that a fund can explain, test and revisit, and put in front of its board, its investors and its regulators. It closes by setting out how these pieces fit into one framework: monitoring, stress testing, liquidity management tools and governance.
Key takeaways
- Evidence now matters as much as policy. Supervisory expectations are shifting from having liquidity management tools to being able to justify how they are calibrated.
- Observable trading costs are not liquidation costs. Spreads and volumes describe what happened; they do not show what it would cost to sell a large position by a specific date.
- Time is the binding constraint. If cash cannot be raised and settled by the payment deadline, the issue is a liquidity shortfall, not just a higher cost, and a higher swing factor will not fix it.
- Equities and bonds need different evidence. Equities have plentiful data but hidden crowding risk; bonds often require liquidity to be inferred from comparable instruments.
- The same evidence strengthens every tool. Credible liquidation-cost estimates support swing pricing, dual pricing, gates and side pockets, within the fund’s governance framework.
Introduction
Liquidity risk management is moving beyond selecting the right tools. The more difficult task is demonstrating that those tools are calibrated to the costs a fund would actually face when it needs to trade. That demands more than an estimate of how quickly assets can be sold: it requires an understanding of execution costs, market impact and how liquidity changes when many investors seek an exit at once. Regulatory developments around UCITS, AIFMD II and supervisory expectations for liquidity management tools have reinforced this shift from policy to evidence.
The starting point: what does it really cost to trade?
A liquidity analysis often begins with information that appears straightforward: traded volumes, bid–ask spreads, transaction prices and the time required to liquidate a position. Together, these measures help describe the ease with which a security can be converted into cash. None, however, should be treated as a complete description of executable liquidity.
Volume Weighted Average Price (VWAP), for example, summarizes the average execution price over a period, weighted by transaction size. Where buyer- and seller-initiated trades can be identified reliably, comparing their execution prices can provide an indication of trading asymmetry. The difference between a trade price and the prevailing mid-market price can also help estimate the economic cost of accessing liquidity.
These signals should be interpreted with care. Effective trading cost and realized execution cost may describe overlapping aspects of the same slippage; they are not necessarily separate charges to be added together. Nor is a low estimated execution cost necessarily achievable if it assumes that the manager can trade over a longer period than the fund can afford.
A useful distinction is between observable trading costs and expected liquidation costs. The former describes what happened in a particular market or execution. The latter asks what might happen if the fund were required to sell a specified amount, over a specified horizon, under the conditions prevailing at that time.
Time is often the binding constraint in liquidity management. A manager may prefer to sell gradually to minimize market impact, but a fund must meet redemption payments, margin calls or other liabilities on specific dates. A position that can be sold at a reasonable cost over seven days may be far more expensive to liquidate in one day. If the cash cannot be raised and settled by the payment deadline, the issue is not merely a higher transaction cost: it is a potential liquidity shortfall.
Market impact: the cost that spreads alone cannot explain
Transaction costs are commonly considered in three broad categories: explicit costs such as commissions and taxes; implicit costs such as crossing the bid–ask spread; and market impact, the additional price deterioration that arises when an order consumes available liquidity. A quoted spread tells us something about the cost of immediacy near the best prices, but often very little about the price at which a much larger position could actually be sold.
Market impact depends on the size and urgency of a proposed trade relative to the capacity of the market to absorb it. A transaction equal to a small share of normal trading activity may have little effect, while an order representing a substantial proportion of daily volume may force execution at increasingly unfavorable prices. A fixed payment deadline can intensify this effect by preventing the manager from extending execution over more trading days. The relationship is nonlinear, and it can change abruptly in stressed markets.
Equities: plentiful observations, but hidden crowding risk
Listed equities generally offer an extensive record of prices, spreads, turnover and, where available, order-book conditions. That makes it easier to estimate normal-market execution costs. Yet apparently abundant liquidity can conceal a more subtle vulnerability: concentrated ownership and correlated investor behavior.
A highly traded equity may become unexpectedly costly to sell when multiple funds unwind similar positions, systematic strategies reduce exposure together or a negative market event triggers a rush to sell. Reported turnover may even rise during such episodes, despite a reduction in the depth available at acceptable prices. The problem is not a simple shortage of observations; it is that yesterday’s observations may say too little about tomorrow’s synchronized selling pressure.
Equity market-impact analysis therefore benefits from signals that capture changes in volatility, sector and factor crowding, investor concentration, order-flow imbalance and broad risk sentiment. Such indicators help distinguish ordinary high-volume trading from stressed conditions in which many participants are competing for the same liquidity.
Bonds: pricing information is available, but executable liquidity is less visible
The fixed-income challenge is different. Bond markets do provide trade reports, dealer quotations, pricing services and electronic execution data, but observations can be fragmented, intermittent or difficult to compare. Many corporate bonds trade infrequently; quoted prices may be indicative, reflect small sizes, or depend on a dealer’s willingness to warehouse risk.
As a consequence, a reliable bid–ask spread can be difficult to establish. A last-traded price may be stale, while two transactions in the same bond may have very different sizes or occur under materially different credit and interest-rate conditions. A difference between a theoretical bond price and an actual execution price may reflect liquidity, a change in fair value or some combination of the two. Treating the full difference as market impact would overstate what the evidence supports.
The lack of recent trades does not, by itself, prove that a bond cannot be sold. It means that its liquidity may need to be inferred using evidence from similar instruments. Bonds sharing an issuer, credit profile, coupon structure, currency or maturity can offer useful information, even when the specific security under assessment has limited transaction history.
Making market-impact estimates adaptive
A practical foundation is the square-root market-impact relationship, which links execution costs to the proportion of market trading capacity consumed by a transaction. It provides a transparent starting point: larger trades generally produce greater price impact, while spreading execution across more trading days can reduce daily participation. But the execution horizon cannot be extended freely when cash must be available by a predetermined liability date.
The proposed approach retains that foundation but allows the sensitivity to high participation to vary by instrument and market regime. In a simplified form:
Impact cost rate = α × L × √p × (1 + γ × p)
p = trade size ÷ (execution days × average daily volume)
Here, L represents an observed or estimated liquidity indicator, such as the bid–ask spread; α sets the baseline sensitivity; and p represents the share of average trading volume targeted each day. The coefficient γ is the participation amplification coefficient: it describes how strongly execution costs increase beyond the basic square-root relationship as participation rises.
The role of machine learning is specifically to estimate γ. Instead of imposing one constant coefficient across the entire universe, a signal-based model can produce an instrument-specific, time-varying estimate based on features associated with heightened execution difficulty. The market-impact formula remains interpretable; the predicted coefficient makes it more responsive to differences between securities and market environments.
What drives an ML-estimated γ for fixed income?
In plain terms, the model helps answer a basic question: how liquid is a bond likely to be, even when there is little direct trading evidence? That answer is the foundation for estimating the potential cost and time needed to liquidate a position.
For bonds, a feature-based model can learn from executions and quoted liquidity across comparable traded securities. Candidate inputs include issuer credit spread and its recent changes, pricing-model outputs and deviations from fitted issuer curves, coupon rate and structure, currency, remaining maturity, issue size, rating, sector and historical trading activity. Pricing functions can contribute measures such as yield, duration or spread sensitivity, helping the model distinguish ordinary valuation movements from execution-related price concessions.
The model need not find an identical bond. It can learn how combinations of characteristics are associated with the amplification of transaction costs across a broader population. This is particularly relevant when the security being assessed trades rarely, but comparable bonds have supplied recent execution evidence.
Training such a model requires care. Historical execution records should be used to isolate incremental market impact from spread costs and ordinary price movements. Infrequently traded bonds create a selection problem, since the securities for which transactions are observed may be systematically more liquid than those for which predictions are needed. Model outputs should therefore be validated by instrument type and market regime, accompanied by uncertainty estimates, and subjected to conservative assumptions where comparable evidence is weak.
From instrument-level estimates to a liquidation plan
A fund does not liquidate an abstract liquidity score; it sells particular positions in particular quantities to meet an actual cash obligation. That is why estimated trading costs must be assessed alongside the time required to execute transactions (Time-to-Liquidate, or TTL), the additional time needed to receive settled cash (Time-to-Settle, or TTS), available cash buffers and the dates on which liabilities fall due.
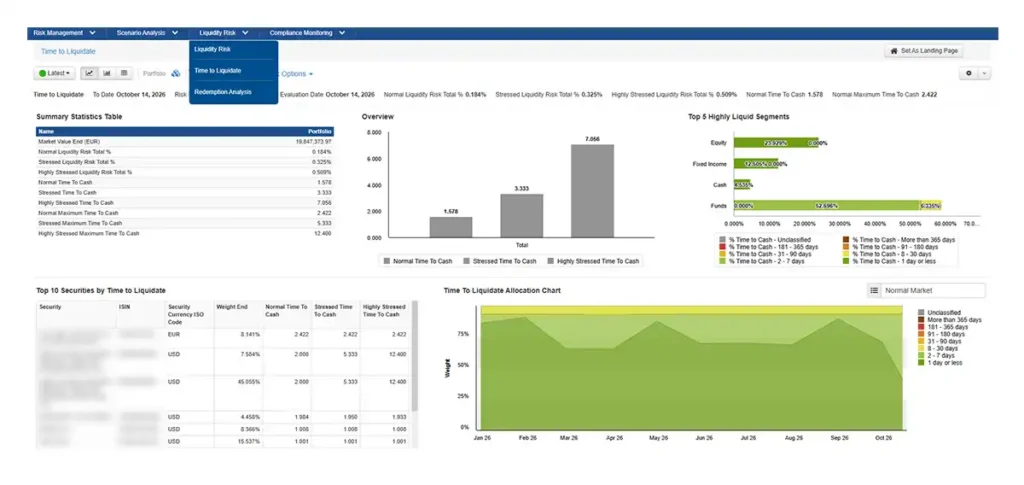
The same position can have very different expected costs depending on whether it can be sold over one day, a week or a month. The critical question is not only how long liquidation would take at a prudent participation rate, but whether the resulting cash can be delivered before the fund must pay investors or other counterparties. When the available window is shorter, the manager may have to accelerate sales, accept higher market impact, use liquidity buffers or consider an appropriate liquidity management tool. Where even accelerated execution cannot generate sufficient settled cash, the analysis should identify the liquidity shortfall explicitly rather than assume a longer execution period is available.
Portfolio-level analysis adds another dimension. Pro-rata sales across all holdings, liquidity-first sales and cost-aware liquidation strategies can produce materially different outcomes. Selling only the easiest assets may lower immediate execution costs but increase the concentration of less liquid exposures left behind. Selling proportionally may preserve portfolio characteristics but force costly trades in bonds or other thinly traded positions.
Liquidity stress testing should apply changes in spreads, available trading volume, execution capacity and investor behavior to these strategies, while imposing the fund’s actual payment deadlines. It must also recognize that multiple holdings may deteriorate together—especially when the portfolio shares issuers, sectors, equity factors or investor ownership patterns. Scenario analysis should therefore ask both what forced sales might cost and whether enough cash would be available in time.
Turning estimated liquidation costs into swing-pricing evidence
Swing pricing seeks to protect existing investors from the costs generated when subscriptions or redemptions require the fund to transact. The analytical task is to estimate those costs realistically, then apply a governance framework that determines when and how the fund’s dealing price is adjusted.
A practical calibration process begins with a proposed flow scenario and the deadline for meeting it. The manager identifies the cash required, available buffers, expected settlement dates, securities likely to be traded and a feasible liquidation strategy. Expected explicit transaction costs, spread-related costs and incremental market impact are then estimated without counting the same execution slippage twice. These costs can be recalculated across normal, stressed and highly stressed liquidity conditions, always respecting the payment horizon rather than assuming the portfolio can be unwound at leisure.
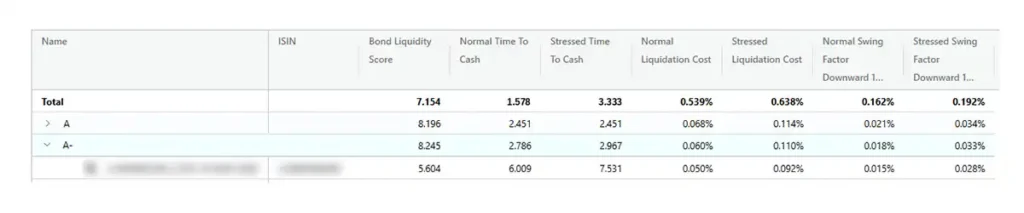
This produces a set of evidence-based estimates rather than a single permanent swing assumption. A modest redemption may be met with cash or liquid positions at limited cost; a larger outflow may force quicker sales and greater market impact. Where the required cash cannot be raised and settled by the deadline, a higher swing factor alone does not solve the problem: the manager must assess the liquidity gap and the tools available under the fund’s governance framework.
Two normalizations should not be confused. The estimated liquidation cost divided by the fund’s NAV shows its significance relative to total fund assets. The cost divided by the relevant net investor flow can inform the anti-dilution adjustment intended to recover costs from transacting investors, subject to the fund’s specific swing-pricing policy. A fund’s flow thresholds, pricing rules and caps remain governance choices rather than outputs of the impact formula alone.
Back-testing can compare estimated and subsequently realized trading costs, review the behavior of swung and non-swung NAVs, and assess whether calibration assumptions remain reasonable under changed market conditions. The purpose is not to automate an official fund price independently of the administrator, but to provide an auditable explanation for the assumptions used in the pricing mechanism.
The same evidence strengthens other liquidity management tools
The benefits extend beyond swing pricing. Dual pricing also depends on credible estimates of the costs of buying and selling assets; redemption gates require an understanding of whether a fund can meet outflows within its dealing cycle; and side pockets require managers to identify and monitor exposures that cannot reasonably be sold alongside more liquid holdings.
For redemption gates, a comparison of projected redemptions with cash and executable liquidity can identify the point at which meeting outflows becomes increasingly disruptive. For side pockets, separate monitoring of less liquid positions can help make the effect on remaining investors more visible. These decisions require quantitative evidence, but they also require clear governance, investor fairness considerations and operational processes.
Across these tools, the same essential questions apply: how much of the portfolio can realistically be converted into settled cash, how quickly that cash is needed, how trading costs might rise when liquidity deteriorates, and whether the chosen response allocates those costs fairly among investors. Reliable answers depend on transparent assumptions, consistent stress testing and regular review as market conditions change.
Putting it together: four elements of a resilient framework
The sections above describe the working parts of a liquidity risk framework. Taken together, they form four elements that depend on one another. A weakness in one limits the value of the others, so they need to operate as one framework, not as a set of separate reports
| Element | What it covers |
| Monitoring | Instrument-level liquidity estimates that go beyond quoted spreads and volumes, recognizing crowding risk in equities and sparse data in bonds. |
| Stress testing | Liquidation plans tested against the fund’s actual payment deadlines, under normal, stressed and highly stressed conditions, including whether enough settled cash would be available in time. |
| Liquidity management tools | Swing pricing, dual pricing, redemption gates and side pockets calibrated from estimated liquidation costs, not static assumptions. |
| Governance | Clear ownership of thresholds, pricing rules and caps, with model validation by instrument type and market regime, stated uncertainty, backtesting and regular review. |
Conclusion: from calibration to evidence
The central challenge in liquidity risk management is not choosing between a simple model and a more sophisticated one. It is knowing what the available evidence can support, where the uncertainty lies and how an estimate connects to a real fund decision.
Predictive techniques such as machine learning could complement these approaches, provided they are supported by adequate data, empirical calibration and independent validation.
What this means for fund managers
- Check that swing pricing and other tool calibrations are tied to estimated liquidation costs, not static assumptions.
- Build payment deadlines and settlement time (TTL and TTS) into every liquidation scenario and stress test.
- Validate models by instrument type and market regime, state the uncertainty, and review assumptions regularly.
Ultimately, a resilient liquidity framework turns measurements into decisions that can be explained to a board, an investor or a regulator: what the fund could sell, what it might cost, whether the resulting cash would settle in time to meet liabilities and what response is justified if it would not.
How Revolution can help
Putting this into practice means seeing trading conditions, portfolio exposures, liquidation horizons and payment deadlines together. Confluence Revolution supports each step:
| The challenge | What Revolution delivers |
| Know what each position costs to trade | Instrument-level liquidity scores and indicators, comparing market and modeled bid–ask spreads. |
| See portfolio liquidity as conditions change | Portfolio time-to-cash under normal, stressed and highly stressed conditions. |
| Test what a forced sale would cost | Redemption stress tests that compare liquidation outcomes across time horizons. |
| Build evidence for swing pricing and other tools | Liquidation costs and swing factors calculated by scenario, so calibration is backed by data. |
| Monitor side-pocketed assets | Segment-specific monitoring of side-pocketed assets alongside the broader portfolio, using carve-out functionality. |
See how Confluence helps fund managers monitor liquidity, stress test portfolios, calibrate their liquidity management tools and evidence the decisions behind them. Contact the team.
About Confluence Revolution
Revolution is a trusted enterprise investment analytics solution that helps asset managers, asset owners, wealth managers, and service providers transform complex investment data into actionable insights. Built on decades of expertise in performance measurement, attribution, GIPS® compliance, risk analytics, and regulatory reporting, Revolution delivers accurate, scalable, and transparent analytics that investment professionals can trust.
Further reading: Bucci et al. (2019), “Crossover from Linear to Square-Root Market Impact”; Farmer et al. (2013), “How Efficiency Shapes Market Impact.”
Disclaimer
The content provided by Confluence Technologies, Inc. is for general informational purposes only and does not constitute legal, regulatory, financial, investment, or other professional advice. It should not be relied upon as a substitute for specific advice tailored to particular circumstances. Recipients should seek guidance from appropriately qualified professionals before making any decisions based on this content.
Unless otherwise stated, Confluence Technologies, Inc. (or the relevant group entity) owns the copyright and all related intellectual property rights in this material, including but not limited to database rights, trademarks, registered trademarks, service marks, and logos.
No part of this content may be adapted, modified, reproduced, republished, uploaded, posted, broadcast, or transmitted to third parties for commercial purposes without prior written consent.
Authors


About Confluence® Technologies
Confluence is a leading provider of specialist regulatory, analytics, and investor communication solutions for asset managers, asset servicers, investment consultants, and asset owners. Across performance, risk and peer analytics, regulatory filings and compliance monitoring, and shareholder reporting and document production, firms depend on Confluence for output they trust. We deliver this through deep domain expertise and purpose-built products developed over decades of research and engineering.
Confluence solutions are powered by Confluence POINT, AI-enabled automation that runs within and alongside Confluence’s trusted solutions. POINT optimizes inefficient workflows, delivering a meaningful impact on outcomes without requiring significant operational change.
Headquartered in Pittsburgh, PA, with 750+ employees in 15 offices across the United Kingdom, Europe, North America, South Africa, and Australia, Confluence services over 1,000 clients in more than 40 countries. For more information, visit www.confluence.com.
Confluence Media Contact:
Jon Schubin
Cognito